A Forecasting Model of the Economy :
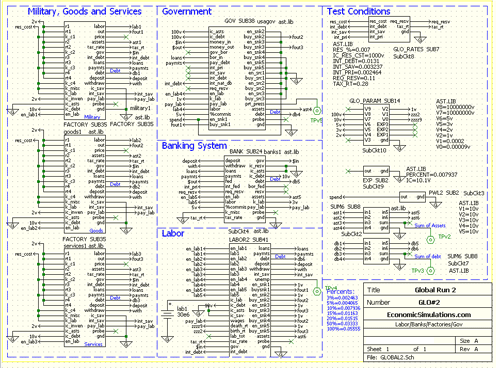
 This model includes factory output, the services sector, the military, the government, the banking system,
and the labor force. The model also includes the birth rate, the death rate, and taxation.
Top Level Model Shown Below :
The details inside each sub-block are not visible at this level. Each sub-block is simulated and verified before it is added to the model. Click here to see model tutorials.
The Results :
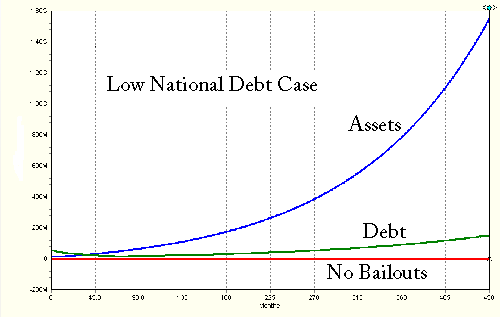
The simulation result with low national debt is shown below. The horizontal axis shows time. The vertical axis shows wealth. Note how the output of the economy (assets in blue) increases over time while the national debt (green) remains under control.
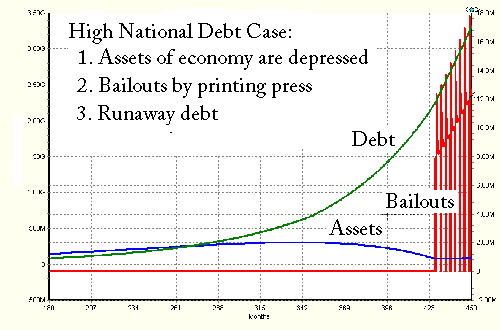
Below is the same simulation where the only change is a slight increase in the interest on the national debt. Note how the runaway debt (shown in green) drives down the output of the economy (shown in blue). More spending is paying the debt and less spending is available for a vibrant economy.
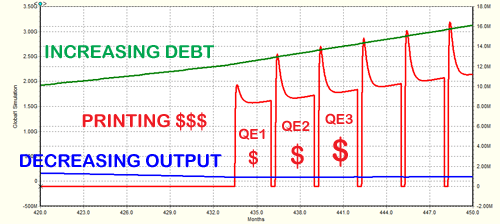
Finally, as the debt balloons, the last resort is to crank up the printing press (shown in red). Doesn't this look like Quantitative Easing (QE) where more money is printed by the Fed? Note that each time a larger amount of money must be printed to pay for the growing debt, just kicking the can down the road.
What happens when we reach the end of the road or the can is too big to kick? We see that printing more money increases inflation, while a slowdown in output results in recession.
We have inflation and recession at the same time!

Below is a blow up of the above simulation.

