Modeling Interest Rate:
To illustrate how to model interest rate, we will use an example of a saving
account earning 10% interest.
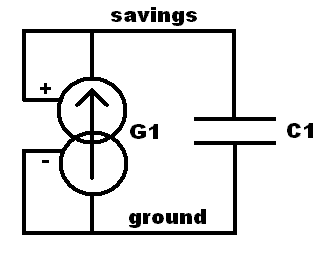
The circuit pictured below models this savings account. The capacitor C1 is
used as a storage element to hold the money. At the start of the simulation,
we will assume that we have and initial value of $10K in the account. We
will apply 10 volts to the "savings" connection of the capacitor at the start
of the simulation to model the initial $10K. The Voltage Controlled
Current Source (VCCS) G1 is used to model an interest rate of 10%. Note that the
positive control terminal of the VCCS is connected to the "savings" connection.
This feeds a current into the capacitor that is proportional to the amount of
the savings. By setting the GAIN value of the VCCS to the correct value we can
model a 10% interest rate (or any other rate) using this circuit.

The equation below can be used to calculate the GAIN term in
the above circuit needed to model a particular interest rate.
This equation only applies when
the capacitor value is 1 farad and one second of simulation
time is equal to one month of real world time. This will
be the case for all of our simulations.

For a 10% interest rate this equation gives us:
GAIN=(10/100)/(12(1+10/200))=0.1/12.6=0.0079365
The SPICE input description format is shown below for
the above savings account model:
* The name of this file is savings.spi
C1 savings ground 1
G1 ground savings savings ground 0.0079365
.IC V(savings)=10
.tran 0.01s 120s
.end
The SPICE program will read the above circuit description file and
run the simulation.
The first line in the SPICE file is always a comment line that
must start with an "*". The second line is the description of
the capacitor. The third line is the description of the VCCS.
The forth line sets the Initial Condition (IC) on the capacitor to 10 volts
to model the initial $10K in the account. The fifth line
tells the SPICE simulator to use a maximum calculation time step of 0.01 seconds and
to run the simulation for 120 seconds. This 120 seconds corresponds
to 10 years since each second of simulation time represents one month
of real time. The final file line is always ".end". The sequence
of the four lines between the first and last line can be changed.
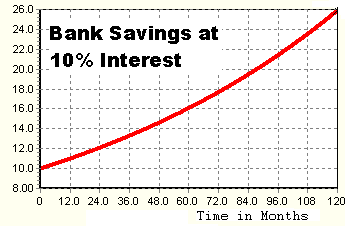
The graph below shows the simulation result.

Below is a comparison of the calculated result and the simulation result:
Calculation | Simulation |
| $11.0K at 1 yr | $11.0K at 1 yr |
| $16.1K at 5 yrs | $16.1K at 5 yrs |
| $25.93K at 10 yrs | $25.92K at 10 yrs |
The % Interest Rate versus GAIN table below can be used to model other
interest rates.
% Interest | GAIN |
| 0.1% | 0.00008329 |
| 1% | 0.0008292 |
| 2% | 0.001650 |
| 3% | 0.002463 |
| 4% | 0.003236 |
| 5% | 0.004065 |
| 6% | 0.004854 |
| 7% | 0.005636 |
| 8% | 0.006410 |
| 9% | 0.007177 |
| 10% | 0.0079365 |
| 15% | 0.01163 |
| 20% | 0.01515 |
| 50% | 0.03333 |
| 100% | 0.05555 |
Back
